
Conversation analytics and AI agent performance in Mujib
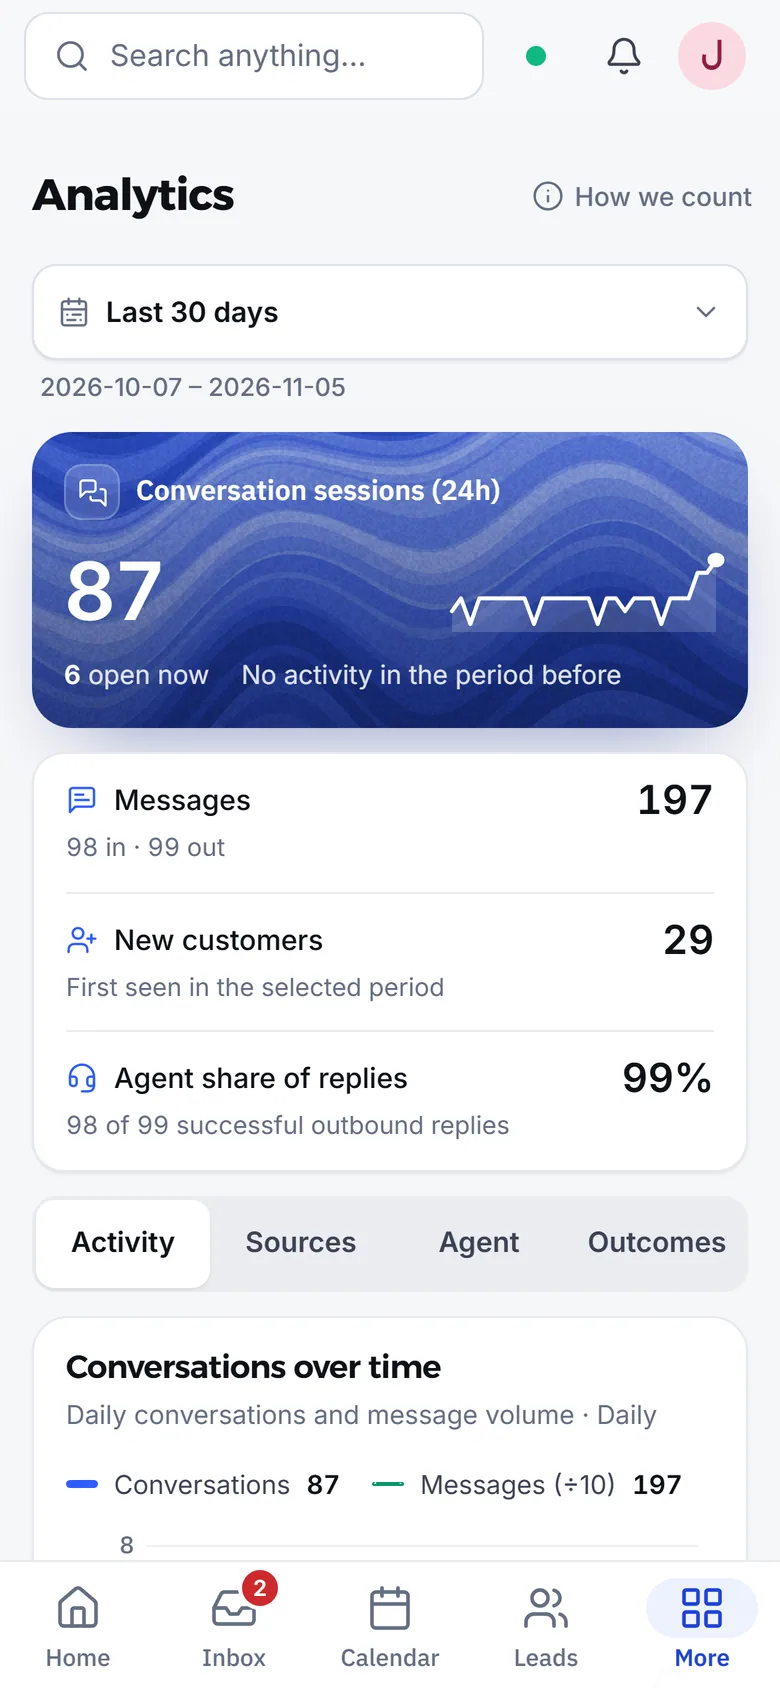
The Analytics page shows conversation analytics for any period you pick: how many conversations and messages reached you, which channels and ads brought your customers, how fast the agent answers, how often your team stepped in, and where the period’s conversations ended up. The headline numbers are compared with the same length of time just before.
What does the Analytics page show?
Section titled “What does the Analytics page show?”Four headline numbers at the top, and four sections under them. On a phone you see one section at a time; on a wide screen all of them show together.
| Number | What it means |
|---|---|
| Conversation sessions (24h) | Conversation sessions in the period, with how many are open now |
| Messages | Every message, incoming and outgoing |
| New customers | First seen in the selected period |
| Agent share of replies | Of all successful outbound replies in the period, how many the agent sent. |
| Section | What it holds |
|---|---|
| Activity | Conversations and messages over time, and the busy hours |
| Sources | The channels and ads that brought your customers |
| Agent | How fast it answers, and how often your team steps in |
| Outcomes | Where the period’s conversations ended up |
How is a conversation session counted?
Section titled “How is a conversation session counted?”Each conversation is a 24-hour customer session, starting with an inbound message or a successful private reply to a comment. It counts on its start date in Amman, even if the customer continues the next day.
Press How we count at the top of the page to see how each number is defined. The arrows beside the numbers compare the chosen period with the same length right before it, so a week is compared with the week before.
To choose the period, press the period button next to the title and pick a ready range or two dates. With more than one branch, you can narrow the numbers to one branch.
When are my customers most active?
Section titled “When are my customers most active?”The Activity section answers with two charts: Conversations over time across the period, and the Busiest hours, when customer messages arrive most.
- Conversations over time shows conversations and messages together across the whole period, so you can see the effect of a campaign, an ad or a holiday.
- Busiest hours has a bar for each hour of the day, or for each two hours on a narrow screen: Inbound customer messages by hour · Amman time. Tap any bar to read its count; the busiest hour is marked.
- Use the busy hours to see when the agent needs your team beside it, and when it can manage alone.
How do I see how the agent performs?
Section titled “How do I see how the agent performs?”The Agent section answers that: how long the agent takes to reply, how often your team had to step in, and what your customers ask about.
- Agent reply speed: From the customer’s first message to the agent’s first reply. The big number is the median: Half the agent replies are faster than this
- Staff intervention rate: Sessions with a reply from your team or a handoff to staff. A high rate means the agent needs more information; see Knowledge base and Handing off to your team.
- Most frequent questions: What your customers ask most, with examples from their messages. Use this list to find what the agent’s information is missing.
- Operational details: how many times the agent ran in the period, and how many of its replies failed.
Where did my customers come from?
Section titled “Where did my customers come from?”The Sources section answers: which channel the conversations came from, and which ad brought the new customers.
- Channel split: Each channel’s share of conversations · Instagram = direct messages only
- Where did your customers come from? Customers who arrived from your ads — and what they did next. For each ad you see the customers, who qualified and who you won, and who booked and showed up when your business uses the calendar. Press Who are they? to see their names.
- An ad counts when Meta or WhatsApp sends its source with the customer’s first message, as with “message us” ads on WhatsApp or Messenger. Anyone who came without an ad counts as arriving directly.
To see how the agent handles people who arrive from an ad or a story, read Ads and stories.
Where did the conversations end up?
Section titled “Where did the conversations end up?”The Outcomes section answers with what the period achieved: bookings, customers won, and each branch’s performance.
| Number | What it means |
|---|---|
| Bookings the agent made | Of all the period’s branch bookings — cancelled ones excluded |
| Customers you won | Of the period’s new customers · by their current stage |
| New customer funnel | New customers in period · current stages |
| Branch performance | Conversations, new customers and bookings per branch |
When your business uses the calendar, Bookings the agent made leads the section and bookings appear in branch performance; without it, Customers you won leads instead. The stages are the customers’ current stages on the Leads page, not the stage they had on arrival.
Who can see analytics?
Section titled “Who can see analytics?”Every account with the analytics permission, and always the account owner and admins. A branch account sees its own branch’s numbers: Bookings and conversations are your branch’s only; customer counts also include customers not assigned to any branch.
For figures per specialist, or a list of whose subscription ends when, see Reports.
Frequently asked questions
What is the difference between a conversation and a message in analytics?
A conversation is a twenty-four-hour customer session that starts with a message from them and can hold many messages. Messages are counted one by one, incoming and outgoing.
Do Instagram comments count in the channel split?
No. Instagram's share in the channel split is direct messages only. A successful private reply to a comment does start a conversation session, though.
Why do I see no ad data?
An ad counts only when Meta or WhatsApp sends its source with the customer's first message, as with "message us" ads on WhatsApp or Messenger.
Does a branch account see every branch's numbers?
No. A branch account sees its own branch's bookings and conversations; customer counts also include customers not assigned to any branch.